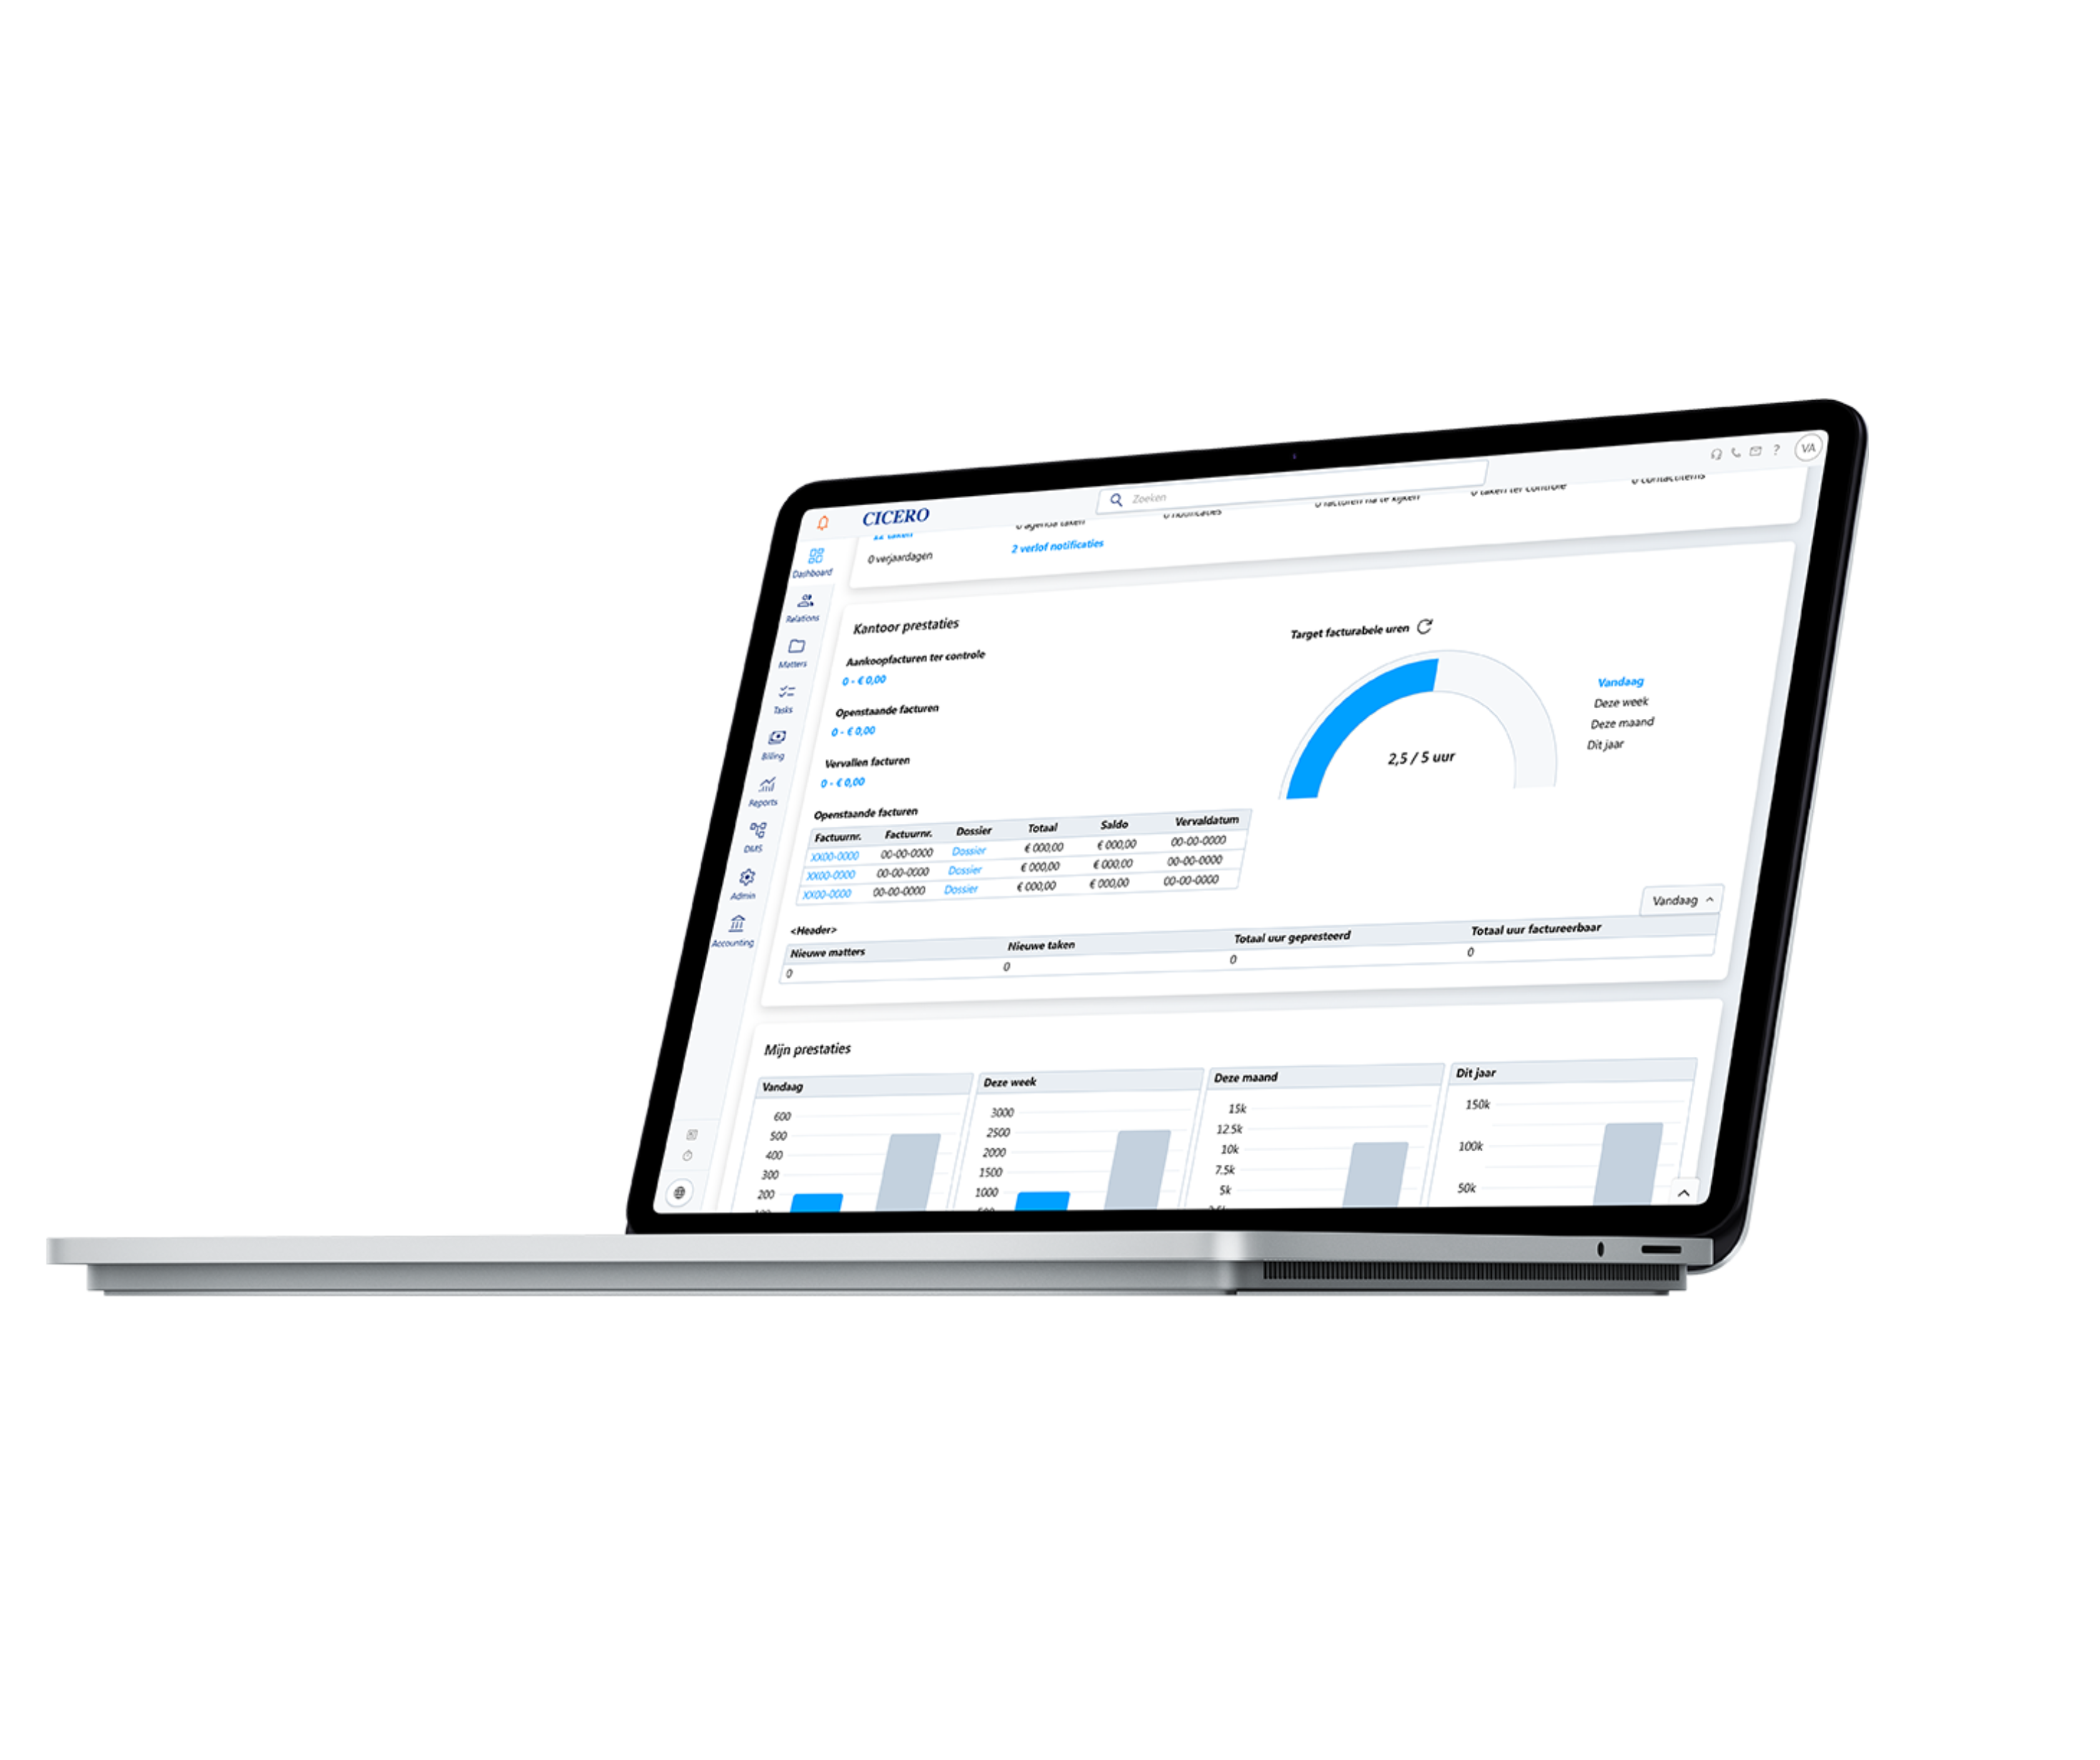
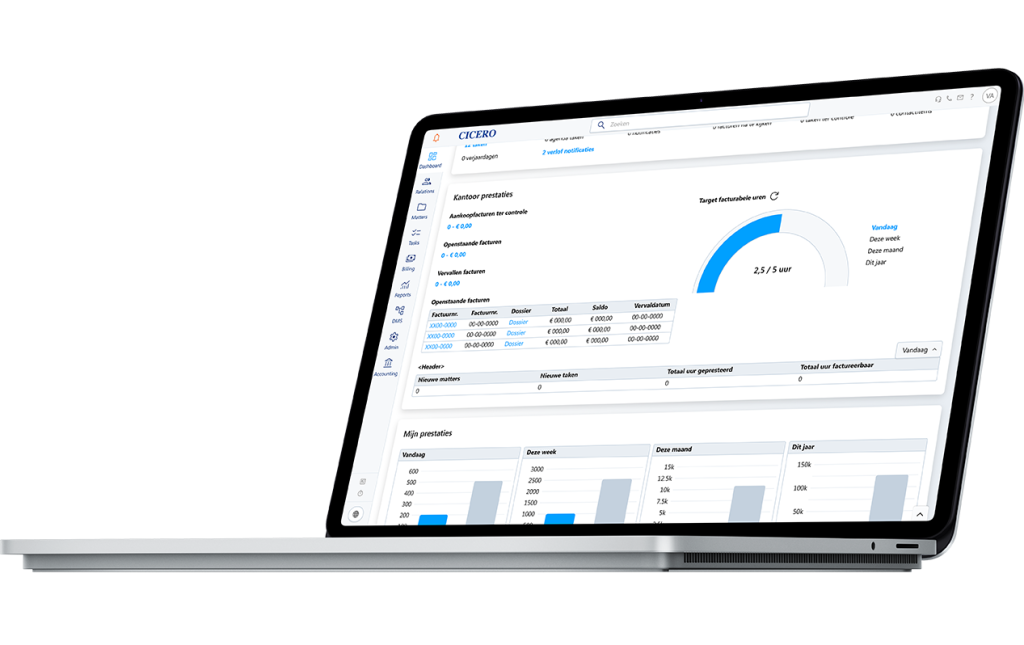
An Introduction to Web Analytics

An Introduction to Web Analytics

In this article, we will have a look at web analytics: what they are, what they are good for, which ones to track, etc. For some of this, we will be using Google Analytics as a practical example.

What are web analytics?

The Wikipedia defines it as “the measurement, collection, analysis, and reporting of web data to understand and optimize web usage. Web analytics is not just a process for measuring web traffic but can be used as a tool for business and market research and assess and improve website effectiveness.” In other words, it is a way of collecting and analysing what is happening on your website: how many visitors you have, where they come from, what equipment they are using, what they are doing on your website, what pages they like, how many times each page is viewed, etc. Web analytics can tell you what is and what is not working on your website. They provide the scientific data that you can base your strategies on.

Google Analytics is the web analytics service that Google offers, and since 2019 is the most used tool for web analytics. The service was first launched in 2005, after Google acquired Urchin. Google Analytics is currently in its fourth version. Other analytics packages that are commonly used, e.g., are Adobe Analytics, Analog, AWStats, Mixpanel, etc. Social Media platforms like Facebook, LinkedIn, Twitter, and Instagram, all offer analytics too to measure what is happening with your content – including ads – on their platforms.

Why use web analytics?

When you create a website, you do it for a reason. There are one or more major goals that outline why you have a website. For a law firm, e.g., you may want to attract potential new clients, educate the public about topics relating to your field of expertise, and have people sign up to webinars you organize. To reach these goals, you define some objectives, which help outline what it takes to achieve your goals. Increasing both the numbers of new and returning visitors for specific pages in your website, e.g., could be an objective. In this example, the number of visitors and returning visitors and whether they increase would also function as a Key Performance Indicator (KPI). As part of your strategy to reach your goals, you can set specific targets.

Web analytics allow you to measure and analyse how your website is performing. They provide you the information to determine whether you are meeting your goals, objectives, KPIs, and targets. They allow you to assess how effective your strategies are. They tell you what is working and what is not. They show you what audience you are attracting and how they are behaving. They also reveal what equipment your visitors are using, like whether they are on mobile, tablet or PC. As such, they also allow you to adapt your strategies to create a better user experience for your website visitors. Because you get a clearer view of your audience, you can better accommodate their needs and expectations.

How does it work?

Basically, there are two different ways web analytics can be set up. The most common way is to use specific snippets of code that are inserted in web pages. Typically, the web analytics service provider provides you with a unique ID for each website, and you insert a customized snippet of code into each page of your website. That way, when a browser accesses a web page, information is sent to the web analytics service provider like Google Analytics. And then you can start monitoring your metrics. (It typically takes about a week of collecting data before you have a minimum of useful metrics). These snippets of code generally use JavaScript and tracking cookies, and are handled on the client side, i.e., by the browser of the website visitor.

A second way to track website behaviour is to have code executed on the server instead of in the browser. This approach is more and more being used to track behaviour of visitors using mobile devices. For pages to load faster on mobile devices, the use of external JavaScript is often omitted or kept to a minimum. Server-based web analytics often do use tracking cookies, too.

What to track?

For your website in general, Themisle recommends keeping track of five items: overall traffic, bounce rate, traffic sources, desktop vs mobile visits, and the numbers of new and returning visitors. Let us have a closer look at each of them.

The overall traffic is the number of visits your site gets over a specific period of time (day, week, month, year). New websites tend to attract fewer visitors because people have not discovered the website yet. Ideally, the number of visitors to your website keeps growing as your website grows older. When numbers start declining, that is a sign that you need to make changes because something is not right. Most packages for web analytics typically offer different views for specific periods. In Google Analytics 4, you will find these on the home page of each website you track. It offers an overview for the today, yesterday, the last 7, 28, or 90 days, etc. It is also possible to create custom views.

The bounce rate consists of the percentage of visitors that are leaving your website after visiting a page. The term is used in two ways, i.e., as the percentage that leaves a) after visiting just one page, i.e., any page on your website, without visiting any other pages, or b) after visiting specific pages. Imagine that the visitors, e.g., who go from your home page to the fields of expertise then go a third page, but those who go from your home page to the presentation of the lawyers then leave. Then you know the page with the expertise works as it should, but the one with the presentation of the lawyers does not.

There are some common reasons why visitors leave your website after viewing just one page. These include long loading time, navigation that is not accessible or clear, an unattractive web design, or pages not being optimized for mobile viewers.

The average bounce rate for websites is anywhere between 20 and 70%, where lower is better. As a rule of thumb, however, you do not want a bounce rate that is higher than 30%.

Mind you, a high bounce rate is not always a bad thing. If you do a campaign for a webinar, then the final thing you want your visitors to do, is sign up, and then you show them a confirmation page. That confirmation page will have a high bounce rate, but that is to be expected as there is no real need for your visitors to stay around any longer. Typically, pages with contact information, too, have a high bounce rate, because your visitors have found what they need.

As of version 4 of Google Analytics, the bounce rate has been replaced by a new set of metrics, which is found in the Engagement section. “For a session to qualify as Engaged, the user must be do at least one of the following during their session: a) actively engaged with your website or app in the foreground for at least 10 seconds, b) fire a conversion event, or c) fire 2 or more screen or page views. You will notice several new metrics in GA4 property that are built on top of this concept: Engagement Rate = (engaged sessions) / (sessions), Engaged Sessions per User = (engaged sessions) / (users), Engagement Time = sum (engagement time).” (Ken Williams).

How do your visitors find your website? That is the question the traffic sources answers. There are five common sources. Visitors can get to your website a) by clicking on a link they found on another website; b) by having done a search in a search engine; c) as a result of an email campaign; d) via links on social media; or e) by coming directly to your site. The latter mainly is the case for frequent visitors. In Google Analytics 4, you find this information in the Acquisition section.

A next item to monitor is the number of Desktop vs Mobile visits. These days, most visitors to websites use mobile devices. So, it is imperative to accommodate them. But mobile devices come with many different screen resolutions. Most statistics will give you an insight in the many different screen resolutions your visitors are using. Over time, the screen size on mobiles has gradually increased, so, you may no longer, e.g., need to accommodate the smallest resolutions. In Google Analytics 4, you find the relevant information in the Tech section.

The fifth type of statistics to monitor are the numbers of New and returning visitors. Your returning visitors are your core audience. Experts disagree on what constitutes a good ratio between new and returning visitors. Themisle propose as a rule of thumb that if less than 30% of your visitors are return visitors, it usually means something is wrong. In Google Analytics 4, this information is on the home page for each website you track, as well.

Limitations

While web analytics are very useful, it is important to keep certain limitations in mind. To keep track of your visitors, they use tracking cookies, and the ones that use client-side scripts typically also use JavaScript. Both of these technologies can be switched off in the browser or by third-party software like antivirus programs or programs that offer privacy protection. Users, too, can decide to delete cookies. And virtually all modern browsers offer tracking protection, either built-in, or as an optional add-on. Many browsers, like Firefox, Brave, Vivaldi, Tor, and others by default have tracking protection activated. The data you are presented with, can also be distorted other ways. If your visitors use, e.g., a VPN, then none of the location data for them is reliable either.

Furthermore, the GDPR applies. For websites hosted in the EU or targeting visitors from the EU, this implies you must get explicit consent from your visitors to track them.

What this means is that the numbers you are presented with in your web analytics reports only represent a percentage of your visitors. And sometimes, that percentage can be low. To give one example, for one of the websites we host, a comparison between the server logs (that keep track of every page that is presented to visitors) and the web analytics, showed that Google Analytics only included approximately 15% of the actual genuine visitors. (Meaning that robots and crawlers had already been excluded in the report based on the server logs). For most websites, that percentage will be higher, and web analytics will still provide you with many valuable insights.

Sources:


Share this article: